Embed & cite
Take the sign with you.
The live pump sign, on your page. It’s static HTML, about 2 KB, with no script and no tracker; every Monday, when EIA publishes, it re-bakes itself. Embed it once and your page never goes stale.
<iframe src="https://fuelfigures.com/embed/sign"
  width="100%" height="170" style="max-width:420px;border:0"
  title="U.S. gas and diesel prices this week — FuelFigures" loading="lazy"></iframe>
The cards
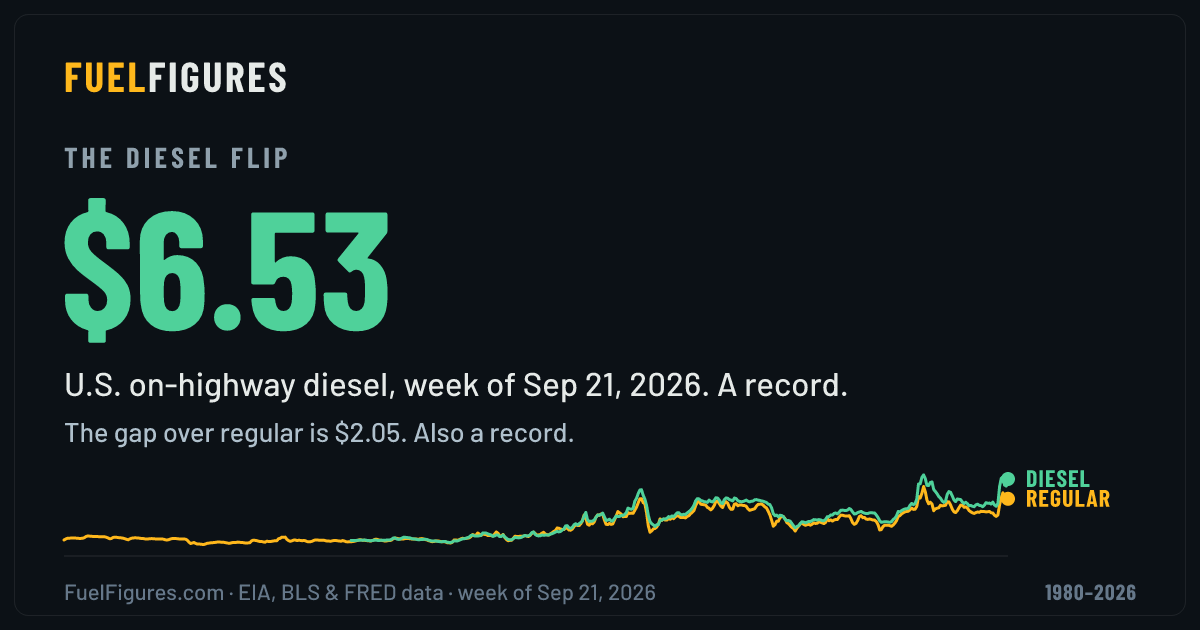
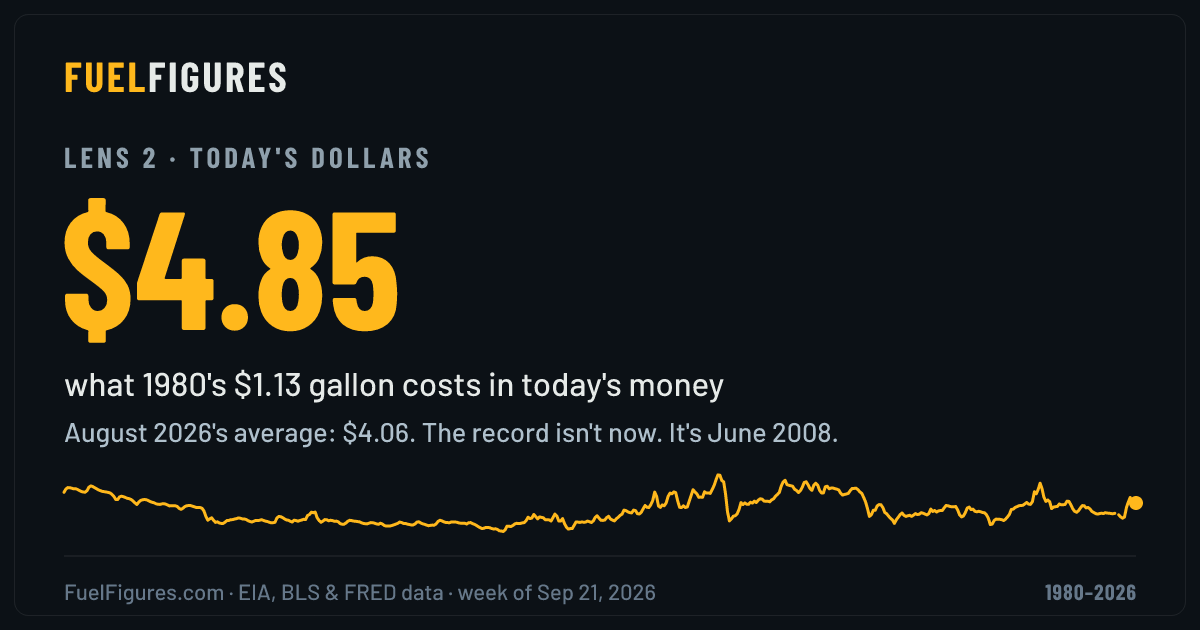
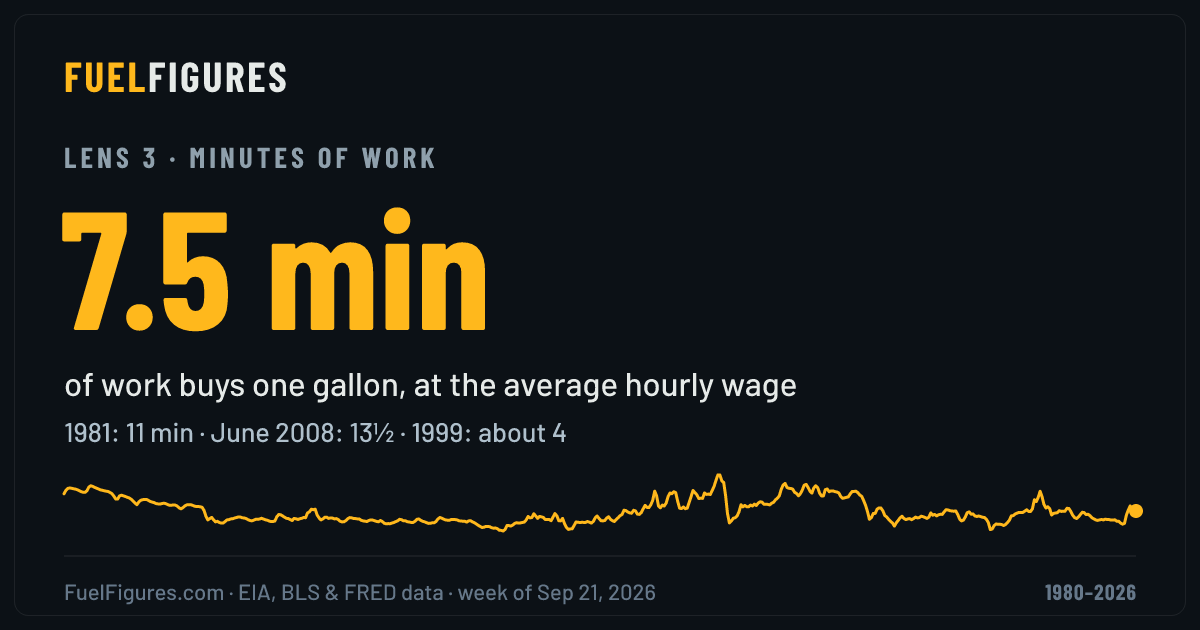
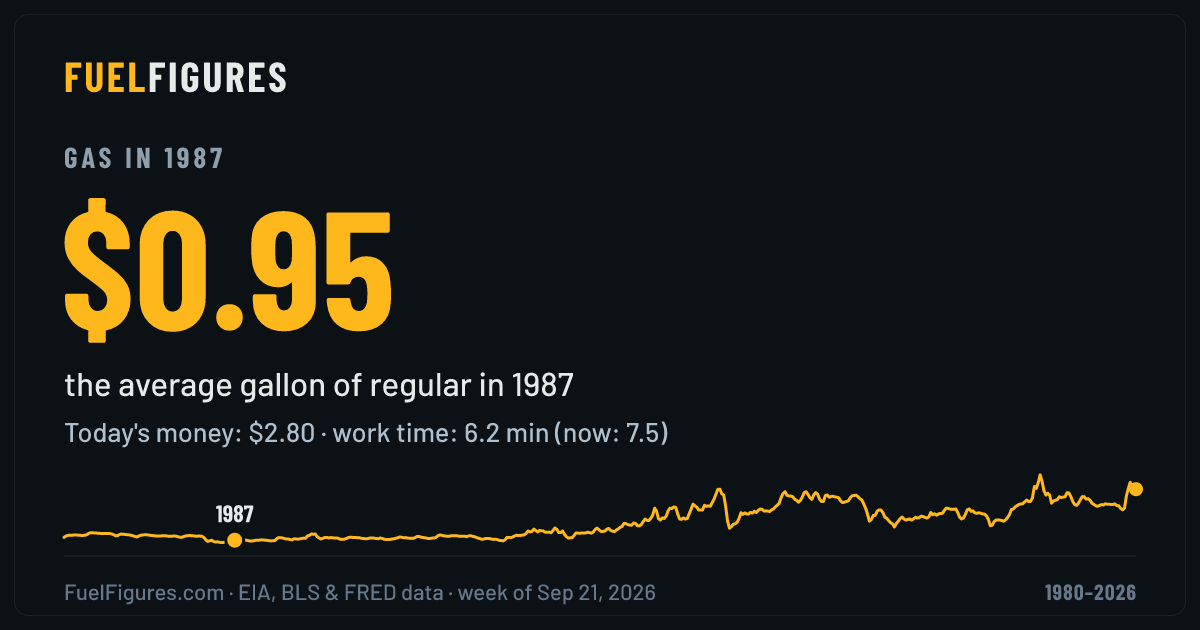
Every view of the site has a share card at fuelfigures.com/og/<view>.png, 1200×630, rebuilt weekly with current numbers. Hotlink them or download them; the source line is drawn into the image, so credit survives any crop. There is one for each year too (og/1987.png, and so on back to 1980).
Cite this
The underlying data is public domain: EIA weekly retail prices, BLS CPI and earnings, FRED series. Our charts, cards and the sign are free to republish with a visible link to fuelfigures.com.
U.S. average retail prices, EIA weekly survey. Analysis and charts: FuelFigures.com.
Want a size, series or format that isn’t here? The full monthly CSV, every series ID and the math behind the charts live at fuelfigures.com/methodology. Ask for anything else: @prestonzeller.